While in the class of statistics and probability, I have learned many important aspects of the subject. To summarize all that I have learned all at once would be a lot to take in and it would be very long. In order to reduce the intake of information at once, I will break up all of the chapters and summarize each accordingly.
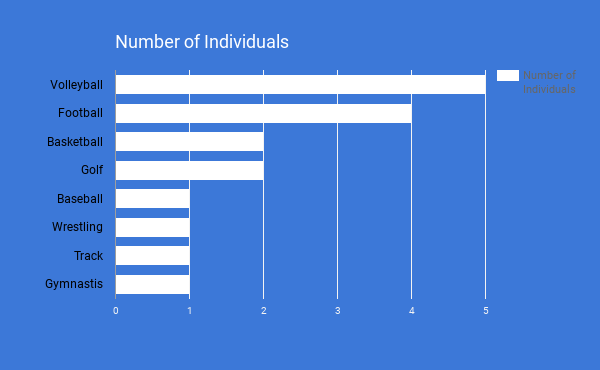
Chapter 1: In this chapter my partner and I surveyed the class on which sport they most preferred in high school. This chapter covered how to conduct a study, experiment, and a survey as well as we learned the differences between the three, and this is why our projects was over a survey of the statistics and probability class. We learned a large amount of the vocabulary of statistics in this chapter such as population/parameters, sample/statistics, placebo effect, lurking variables, etc.. Another big idea to remember in this chapter was the levels of measurement (nominal, ordinal, interval, ratio).
*Below is a bar graph that we used in our Chapter 1 project.*
*Below is a bar graph that we used in our Chapter 1 project.*
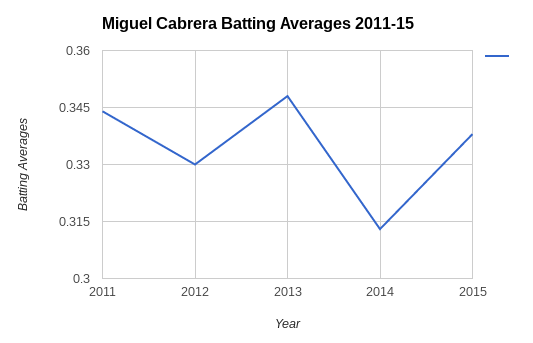
Chapter 2: In this project my partner and I collected data from an MLB site that had a list of the top 50 batters in 2015. We recorded the batting averages for these players, ordered them from least to greatest, and then made a series of charts that help depict certain qualities about the data. Some examples of graphs that we used this chapter include histograms, relative frequency histograms, Pareto charts, time-series graphs, etc.. All of these graphs were necessary in order to organize our data in a neat and practical way, hence the reason for the name of the chapter being ¨Organizing Data."
*Below is a time-series graph that we used in our Chapter 2 project.*
*Below is a time-series graph that we used in our Chapter 2 project.*
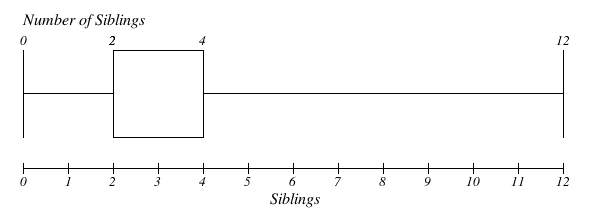
Chapter 3: This chapter was one of the less desirable chapters of statistics because of all of the calculations that are necessary. In the Chapter 3 Project, my partner and I conducted a convenience sample of 50 students in the school and questioned them on how many siblings they had. With this data, there were many calculations that were necessary such as the (75%, 88.9%, and 93.8%) Chebyshev´s interval, the Coeffecient of Variation, the variance, the standard deviation, etc.. We were shown how to calculate most of these values by hand, however the calculator was a helpful tool.
*Below is a Box and Whisker Plot that we used in our Chapter 3 project. The reason this was in our project was because we also learned how to calculate the Inter-Quartile Range of box and whisker plots in this chapter.*
*Below is a Box and Whisker Plot that we used in our Chapter 3 project. The reason this was in our project was because we also learned how to calculate the Inter-Quartile Range of box and whisker plots in this chapter.*
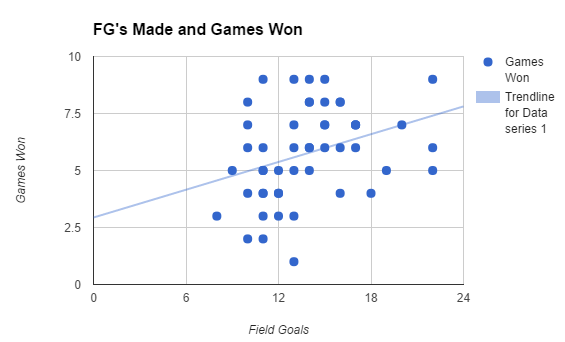
Chapter 4: This chapter pertained to correlation and regression. In this chapter my partner and I recorded and examined data to determine the correlation between the variables. In order to execute this determination my partner and I used a calculator to find the least squares regression, which we are able to interpret to see what type of correlation there is as well as how strong it is. We used a line of best fit in a scatter plot to display the correlation of our data, which was not very strong.
*Below is a scatter plot of the data we accumulated in our Chapter 4 project. This scatter plot also has a line of best fit which shows that the data has a weak correlation.*
*Below is a scatter plot of the data we accumulated in our Chapter 4 project. This scatter plot also has a line of best fit which shows that the data has a weak correlation.*
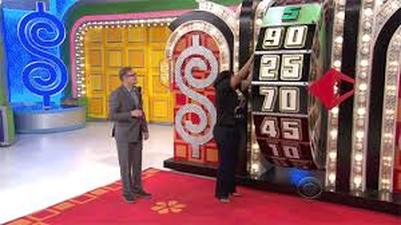
Chapter 5: This chapter was entirely probability. In this chapter, we learned about certain concepts in probability, such as independent, dependent, and mutually exclusive events. In the Chapter 5 project partner groups were assigned certain topic for probability; my partner and I received the topic of "The Price is Right." This project required us to calculate the probability of a simple event and its complement, as well as calculate permutations and combinations pertaining to the game show. This chapter broadened my knowledge on probability greatly. There is no graph or chart used in this project, thus, there is a picture of the price is right wheel from the game show.
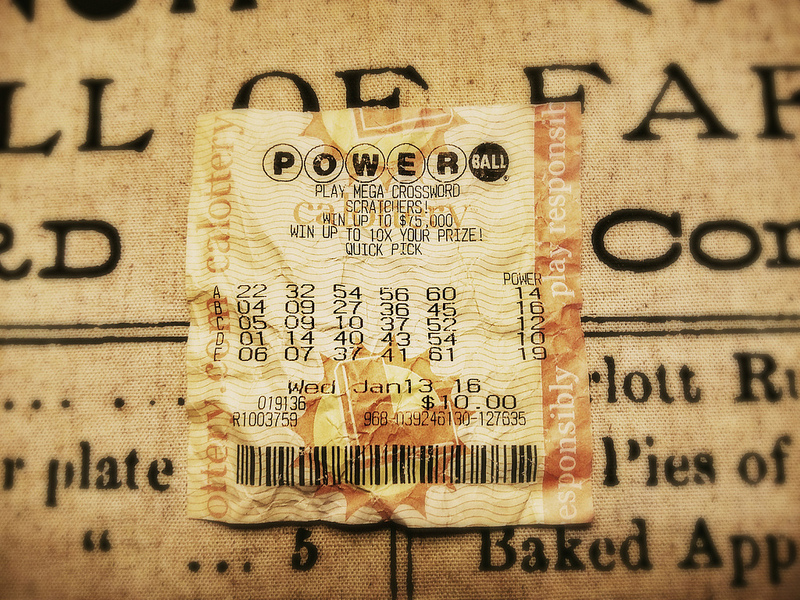
Chapter 6: In this chapter, we learned about binomial probabilities and distributions. The content of this chapter involved discrete and continuous variables and their probabilities. It required that we calculate the mean and standard deviation of varying data and interpret our results in the context of our data. For example, in our chapter project, we calculated varying probabilities involving the Powerball lottery. The outcome of winning the lottery is binomial because you either receive the award, or do not.
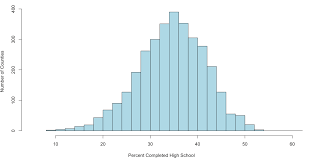
Chapter 7: This chapter, similarly to Chapter 6, is dealing with probabilities. The difference in this chapter, however, is that we covered normal curves and sampling distributions as opposed to binomial distributions, so we covered different scenarios as before. An important note to highlight in this chapter is that in order for data to be considered normal, it has to have a considerable sample size in order for the data to be considered accurate. Since this is the case, every problem must state that the distribution is normal, or it must have a sample size of at least 30 or greater. In the project for this chapter, we conducted a survey of 50 FHS students on their GPAs. With the data we attempted to see if the data would produce a normal distribution, and in our case, it did not.
Chapter 8: This chapter regarded estimation and the requirements that come along with it. In this chapter of estimation we covered point estimates, margin of error, and confidence intervals. one of the most important topic of this chapter would be the confidence intervals, which include finding an interval of values in which you can say a certain value is between with a certain level of confidence. In the chapter project we were assigned a data set and my partner Olivia and I received the topic of crime rates in Denver. Based off of our data, we were required to calculate values such as the margin of error, confidence interval, and critical values based upon the confidence level.
Chapter 9: This chapter involved hypothesis testing on data. There were two initial hypotheses to be pulled out initially from the data, the null hypothesis and an alternate hypothesis, and our goal was to compute a statistical test to determine which of the hypotheses is alid or not based on the probability of chance. Some variables that were important in this chapter included level of significance, type 1 error, type 2 error, and p-value. In the chapter project, we conducted a survey of Fowler High School students to see how they compared to the global average of minutes spent per day on Facebook. We used a systematic random sample of 30 students and our null hypothesis was 20 minutes (based off of the global average) and we received a mean time of 5.23 minutes spent on Facebook per day by Fowler High School students. This average classified as our alternate hypothesis that the average would be different from the global average.

Chapter 10: This chapter was similar to Chapter 9 because we still determined a null and alternate hypothesis, however in this chapter we were testing to see if there was a difference in data sets (Chapter 9 could be greater than, less than, or equal to for an alternate hypothesis). We tested paired differences that are dependent variables, as well as independent variables and the paired differences when dealing with proportions. In the chapter project, each group member was assigned a random problem form the statistics book and we needed to reply to the same questions that Mrs. Lewis assigned to us as a class. Dallas and I had a project involving the number of pollution days in Englewood (a suburb of Denver) vs. the number of pollution days in Denver as a whole.